Title Changes - Proprietary Brands
Google Search Trends
Proprietary Brands Vs "Private Labels"
The graph below displays the term showing its popularity over time. Hover your mouse over the graph to examine different points on the graph.
- Numbers on the graph - The numbers on the graph reflect how many searches have been done for a particular term, relative to the total number of searches done on Google over time. They don't represent absolute search volume numbers, because the data is normalized and presented on a scale from 0-100. Each point on the graph is divided by the highest point and multiplied by 100. When we don't have enough data, 0 is shown.
- Bars next to the chart - When comparing two or more items, bars appear next to the chart. The bar height represents the average of all points on the graph for that search term.
- Downward sloping lines - A downward trending line means that a search term's popularity is decreasing. It doesn't mean that the absolute, or total, number of searches for that term is decreasing.
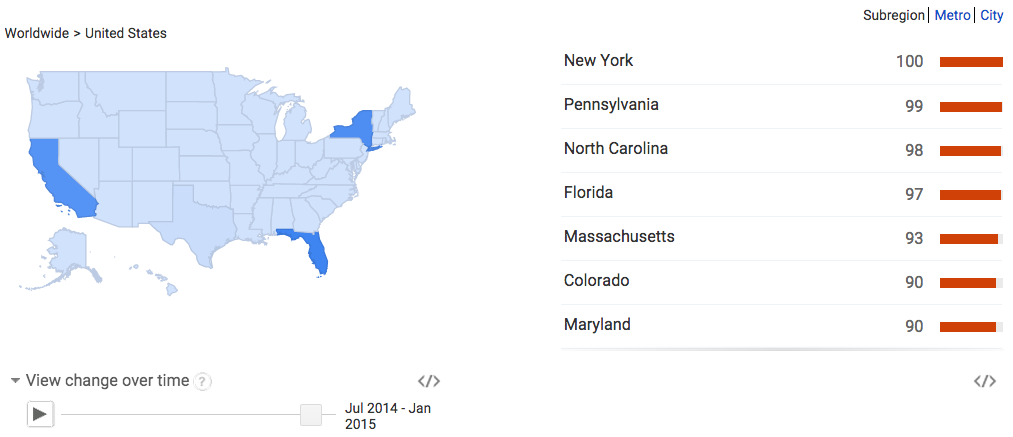
Search Google Trends to Track changes over time for the term
